5 essential Google Analytics reports that you should use every day
Google Analytics provides a vast range of default reports, each containing important dimensions and metrics relating to any aspect of any website. Here are 5 of the most essential Google Analytics reports you will have to look at:
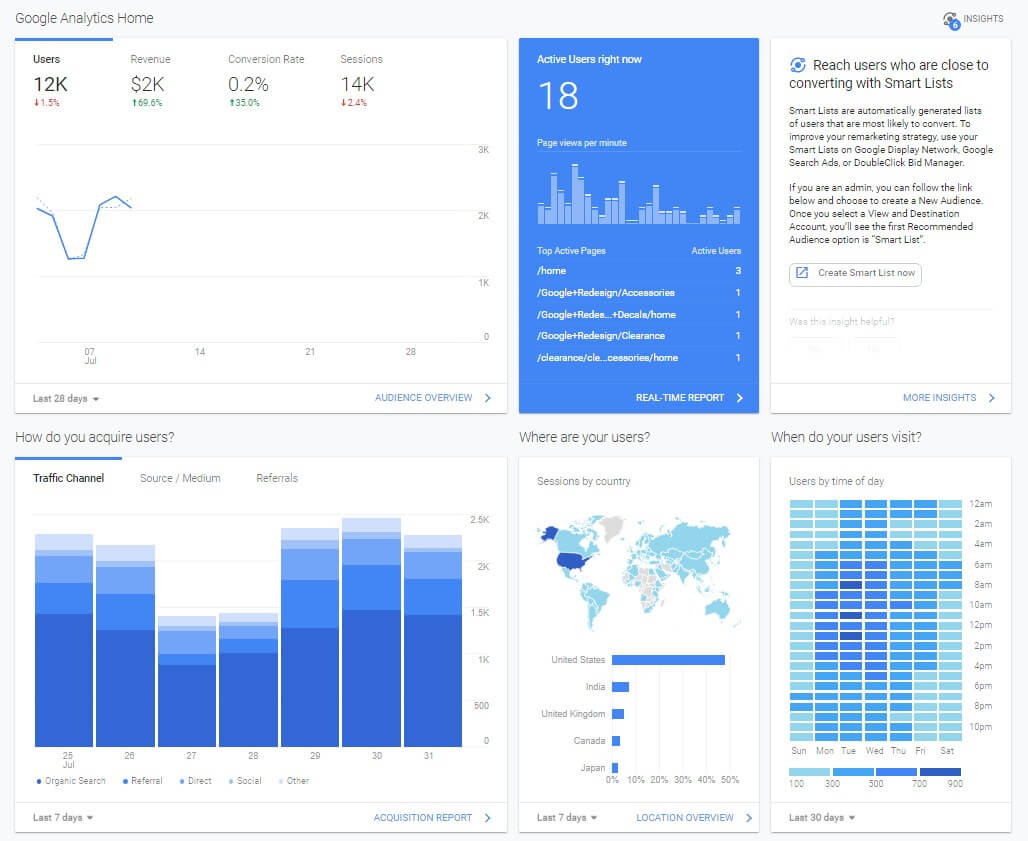
1. Audience Overview

This report summarizes the whole traffic that you have received in a time period, or WHO are your users.
Here you can see how many users have entered your website as well as how many of them were new to your business. This information is also presented as a graph on the right part of the screen.
Understanding how many people come back to your website is, at some point, perhaps more important than generating new leads. A person that comes back to your website does this because they might actually love your content, your products or your services, or all of them.
This report also shows an average of sessions / user, the number of pages viewed in the selected timeframe as well as the average session duration and the bounce rate.

In the bottom part of the report you can filter users based on their location down to the city. You can also go a bit more in depth and see what operating systems they used when they accessed your website as well as from what browser.
All and all this report is one of the 5 essential Google Analytics reports as it displays an overview of your users, where they are from, how much time they spend on your website and how many of them actually love it.
2. Source/Medium report

Knowing your users is just a part of the bigger picture. You also need to know from WHERE are these users coming from.
The Source/Medium report does exactly that: it displays you traffic sources.
It combines the Source of the traffic: google, facebook, instagram, a domain or a parameter set up by you in your UTM parameters.
Then, it combines this Source with a medium: (none), organic, paid search, referral, display or any UTM parameter that you have previously set up.
Google Analytics has a few default channel definitions, but you should always use UTM Parameters in your URLs.
In this report you can see the number of users, new users and sessions per each source / medium. You can also analyze how many users bounce off after they have landed from a certain campaign, how many pages they view and how much time they spend on average on your website.
In the 3rd section of the table you can see ecommerce related data (only if you have the ecommerce setting enabled): conversion rate, number of transactions and revenue. There is also a drop down that allows you to select one or all of your goals.
3. All Pages report

Now that you know WHO are your visitors and WHERE they came from you need to know WHAT they are doing on your website.
The All Pages report shows a break down for each one of your pages.
Here you can analyze how many views each page had and how many of these were unique (meaning that the page was seen only once in a session).
The report also shows what is the bounce rate of each page and how many users exit your website from any one of them.
4. Goals Overview report

In this report you can see how each one of your already created Goals has evolved. You will be able to Goal Completions, Goal Conversion Rates, and the Goal Value, if you have attributed a value to any Goal.
On the bottom right of the report screen there is also a list of pages where the goals have been completed. If all your goals are Destination type goals then this list will ONLY contain the destination pages of your goal.

The second sort option on this report allows you to see what source/medium has proven to be the most efficient:
If you haven’t already, I highly recommend to set up goals in your View. The maximum amount allowed by Analytics is 20 per view, so be sure to set up only the most important goals of your website, be them Thank You Page views, Sign ups, Cart page Views etc.
5. Ecommerce Overview report

Last but not least, the Ecommerce Overview is an essential Google Analytics report for any shop owner.
As the name suggests, this report is created specifically for websites or apps that are selling products or services. In order to be able to see this report you should first set up Ecommerce Tracking.
On first glance the report allows you to see how many sales your website had, the conversion rate of your users, how much revenue you have generated and what is your Average Order Value.

By clicking the buttons above the graph you are able to select a few important ecommerce related dimensions and see how they have evolved in a selected time frame. You can break these down by hour, day, week or month.
The graph also allows you to compare 2 different dimensions. This functionality is great when you want to discover patterns in your users shopping behaviour.
When you open the report it will automatically load a list of your best selling products in the bottom right. The list contains the name of the product, how much revenue it has generated and what percentage of the total revenue was generated by it.
These are the 5 essential Google Analytics reports and you should use check them each and every day.
If you need help with your optimization process, you can always get in touch with us at [email protected] or just leave a comment down below. We’re always happy to hear from you!