
Breaking Down Users by Device Category in Google Analytics
The Device Category report in Google Analytics allows you to break down users by device category to find out what devices your visitors use to browse your website. But before we dive into details, let’s talk a bit about the context.
Throughout the past five years, internet traffic has been increasingly driven through mobile devices. In a study conducted by SimilarWeb that reflects US traffic across the web, in 2018, 58% of site visits were from mobile devices. They also made up 42% of total time spent online. These percentages are getting higher as we speak!
Even so, a great amount of people are still investing a lot of time and effort in designing a groundbreaking desktop layout. And they do this without giving much thought to mobile responsiveness. If you are one of them, you should definitely read this article.
Mobile vs. Desktop: What devices are visitors using to navigate your website?
You focus on offering customers a flawless experience on desktop. And that’s great! However, what if in reality most of your visitors use mobile devices, such as smartphones and tablets to browse your site?
If you’re not yet familiar with your audience’s behaviour, it’s time to find out more!
Open your Google Analytics account and look at data from the last three months. After you’ve selected your dates, go to Audience -> Mobile -> Overview. Here’s what you’re going to see:
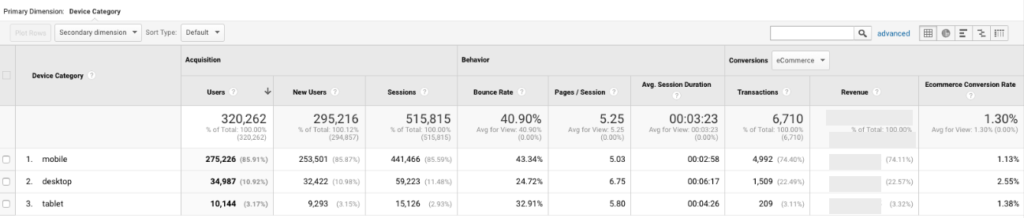
It’s basically a breakdown of all your visitors from the last three months by device category. You can see the number of sessions, users and new users for each segment.
The report also offers details on engagement metrics such as:
- Bounce rate – the percentage of users who left the website without interacting with any page elements
- Pages/session – the average number of pages viewed during a session
- Average session duration – the average length of a session or how much time users are spending on your website during a single session.
If you own an ecommerce store, your priority will be to check how users are converting on each device category. You can do this by looking at transactions, sales and ecommerce conversion rate.
If the majority of your traffic consists of mobile users but their conversion rate is low compared to the conversion rate of desktop users, then that’s a red flag! It means that you must start optimizing your website for mobile ASAP.
How to optimize for mobile: A few tips
- Start by checking the page load time on mobile and if it’s more than 2-3 seconds, it’s time for speed optimization!
- Continue by looking for technical errors and check the functionality of your elements on mobile, such as buttons and forms. Everything should be working perfectly so that visitors don’t encounter difficulties when trying to add a product to the cart or during the checkout process.
- Your product images should be retina-ready (that’s the new standard), so no pixelated photos because this could really drive customers away.
- The low conversion rate could also be related to your cpc campaigns, more precisely to the lack of visual consistency or message match between your ads and your landing pages. If this is the case, you should consider landing page optimization.
While these are just a few suggestions that can help you get started, you’ll still need the opinion of a specialist or of a CRO agency. This way you will ensure an effective conversion rate optimization process.
Bonus tip!
To obtain even more insights, you can add a secondary dimension to the device category report and find out what operating systems users are browsing your website from, like this:
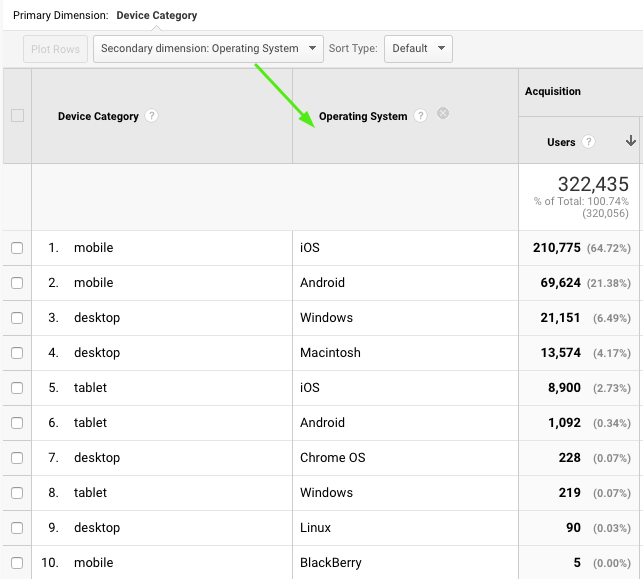
This will help you segment your data even more and narrow down the areas with issues.
You can do the same by adding ‘browser’ as secondary dimension to your report:
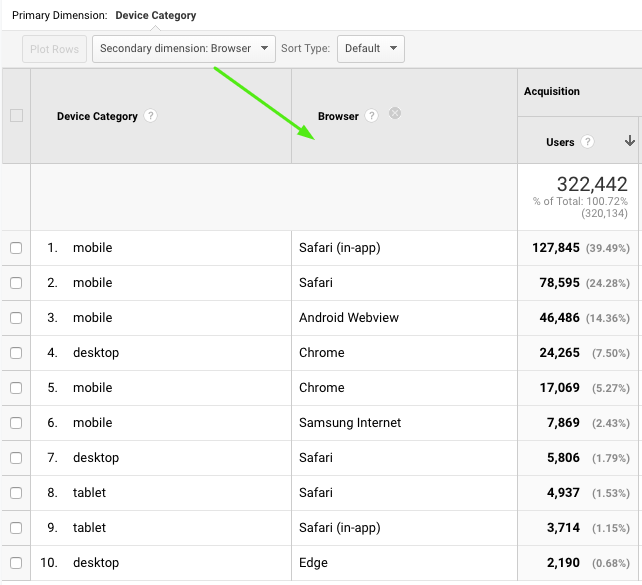
Simply compare each segment’s traffic to its conversion rate and you’ll know exactly where the problems lie. Then you’ll be able to focus on optimizing these areas first.