
Traffic Sources: Scale to success with Ontrack Analytics
Traffic sources can be make-or-break. Generating high-quality traffic is probably the most common issue for online businesses.
Does your website have thousands of sessions with only a few or even no purchases at all? Then you are getting a bunch of low-quality traffic. Don’t worry though, focus on continuous improvement.
The lack of a proper approach can lead to massive losses or even worse, the failure of your online business. By the end of this article, you’ll know exactly how to tackle traffic sources and incorporate them into your marketing strategy.
If the above scenario matches your situation, understanding the insights generated by the traffic sources report is a vital step towards resurrecting your business and generating a healthy profit.
What are traffic sources and how can I use them to increase my website’s performance?
In simple terms, traffic sources are the places where your website visitors came from. This can be a Facebook post, a Google ad, a referral from a blog or countless others, depending on how and where you promote your specific business.
All traffic sources are not born equal, thus, some of them mean more for your website than others. In order to optimize your website, you need to know where your users come from. By correctly identifying and tracking KPIs, you can figure out which traffic source brings you the most valuable traffic. This will help you better understand your audience and devise better marketing strategies in order to gain the needed uplifts in your conversion rate and revenue.
So how does Google Analytics know where people come to your website from?
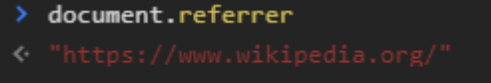
The simple answer is this: when you go from one website to another through a link, your browser records a snippet of javascript called the document of referrer. This script tells analytics what the previous page brought you to the website you’re on.
Ex: here’s what feedback the document.referrer offered me when I entered the google play store via a Wikipedia link.
What kind of traffic sources are there and what do they mean?
By default, google groups traffic using source/medium. The source is where your traffic comes from (ex. Google, Facebook, New York Times and so on). Medium represents the means through which they came to your website. There are 7 types of mediums through which visitors come to your website.
- Direct – Users that come to your website through direct traffic either manually typed your URL in their browser or used a bookmark.
- IMPORTANT: Because the standard attribution model used by Google is last non-direct click, the direct medium is also the place where your untagged traffic is allocated to. This occurs when Google Analytics cannot determine another referring source or channel. So, in order to avoid this problem and track your traffic accordingly, make sure you use UTMs in your campaigns.
- Use this tool to tag all your campaigns, so your analytics can determine how your traffic reached your website.
- Display – Users that came to your website through a banner ad.
- Email – This is traffic resulting from email campaigns.
- Organic Search – These users came to your site by searching a term that you rank for on a search engine. This refers to your SEO, so do not confuse this with search ads.
- Paid Search – This is traffic that resulted from search campaigns on search engines such as google, bing yahoo or others.
- Tip: if you have your Google Ads account linked to your Analytics, Google will automatically assign a gclid id that informs Analytics exactly from what source, campaign and even keyword your visitors accessed your website from.
- Referral – This occurs when a user comes to your website by clicking a link on another website, such as a blog, online magazine or a content website.
- Paid Social – When a user enters your website through a social media link (facebook, instagram, twitter, etc.)
Focus your effort into reaching set goals
It doesn’t matter if we’re talking about time or money: traffic generation is an expensive, time-consuming process. The effort must be aligned with the objectives of your business and the KPIs.that measure the success of your objectives. Traffic sources allow you to understand where your most valuable traffic comes from, so you know where to invest money in order to get a great return.
If you’re unsure about your Google Analytics report interpretation, we recommend using the Ontrack Analytics App. Consider it your virtual data analyst: It takes the data sitting in your Analytics account, interprets it for you and returns actionable insights for increasing your website’s performance.
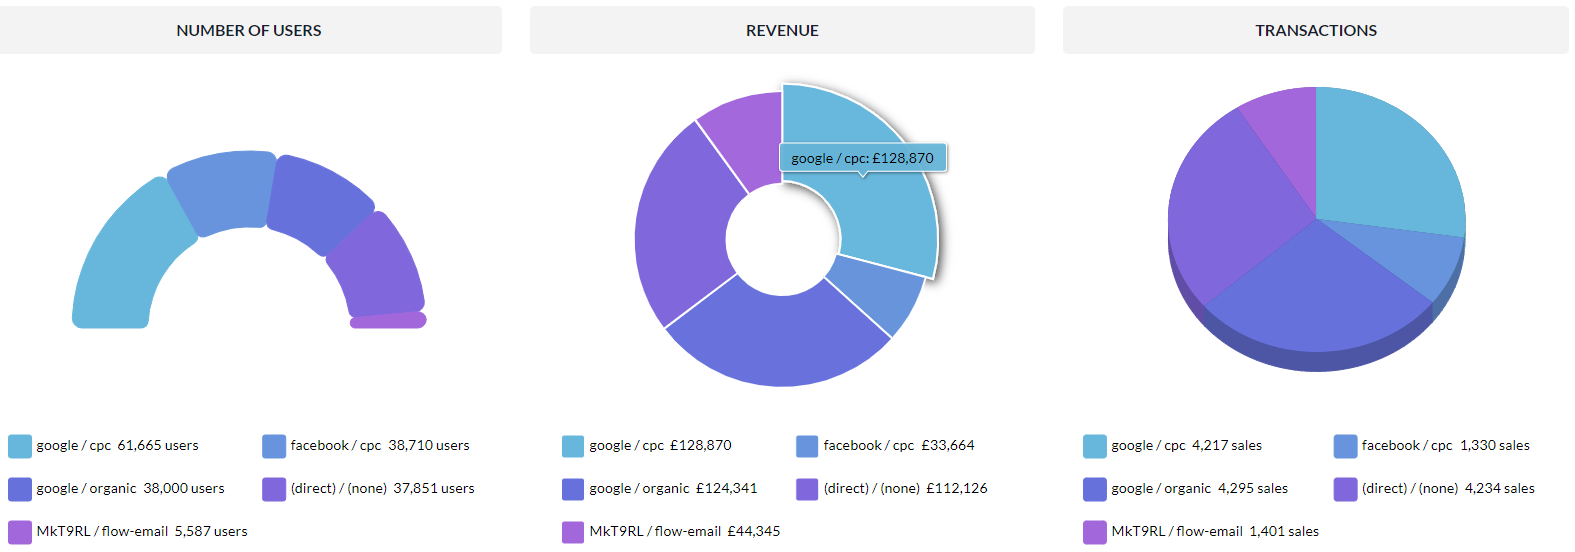
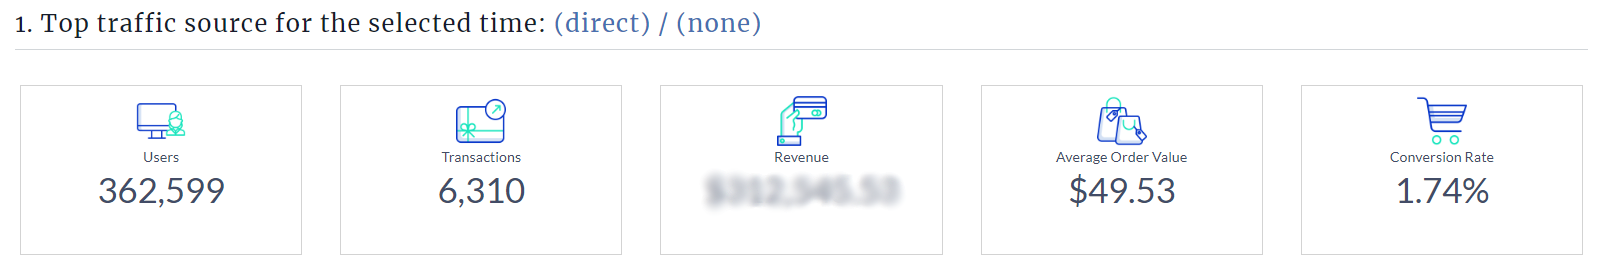
In this specific example, Ontrack Analytics will inform you as to what your top traffic sources are, how many users and transactions they bring, what revenue, average order value and conversion rate they have. All you need to do is log in with your Google Analytics Account and sit back while your reports and insights are generated for you.
Measuring success
Interpreting the traffic sources report can only constitute as an advantage to your strategy’s overall success. It’s a proven method for growing your online business to the next level.
Start by mapping out your top traffic sources and analyze them based on your most important KPIs. What KPIs are those? Think: what is the most important objective of your business? Is it leads, purchases, engagement? How do you determine the metric that defines the success of your objective?
As per usual, this depends on what determines success for your business. Generally speaking, you want to track the number of users, what percent of the total traffic they represent, the number of transactions, how much revenue they bring and their conversion rate.
Once you develop a solid strategy around your top traffic sources, you can test different types of content across different channels and see how they perform.
Quick tip: Do proper research in order to really understand the audience that comes through your sources and optimize the landing pages (that get the most amount of traffic) accordingly. Whatever source you’re experimenting with, always make sure that you’re matching the offer to the audience.
Don’t forget the 80/20 rule because it also applies here: The top 80% of quality traffic usually comes from the top 20% of the traffic sources.
Resources
Related articles
Ontrack Analytics: New vs. Returning Visitors