Ecommerce Metrics Series – Average Order Value Report Q2 2019
In this Ecommerce Metrics Series I will be sharing with you the currently average metrics in the ecommerce world.
Once a week, I will be sharing a different report with a certain metric in focus. This week’s report is about Average Order Value.
All the data in this report was gathered by Monetate in this report,
Average Order Value Report – Q2 2019

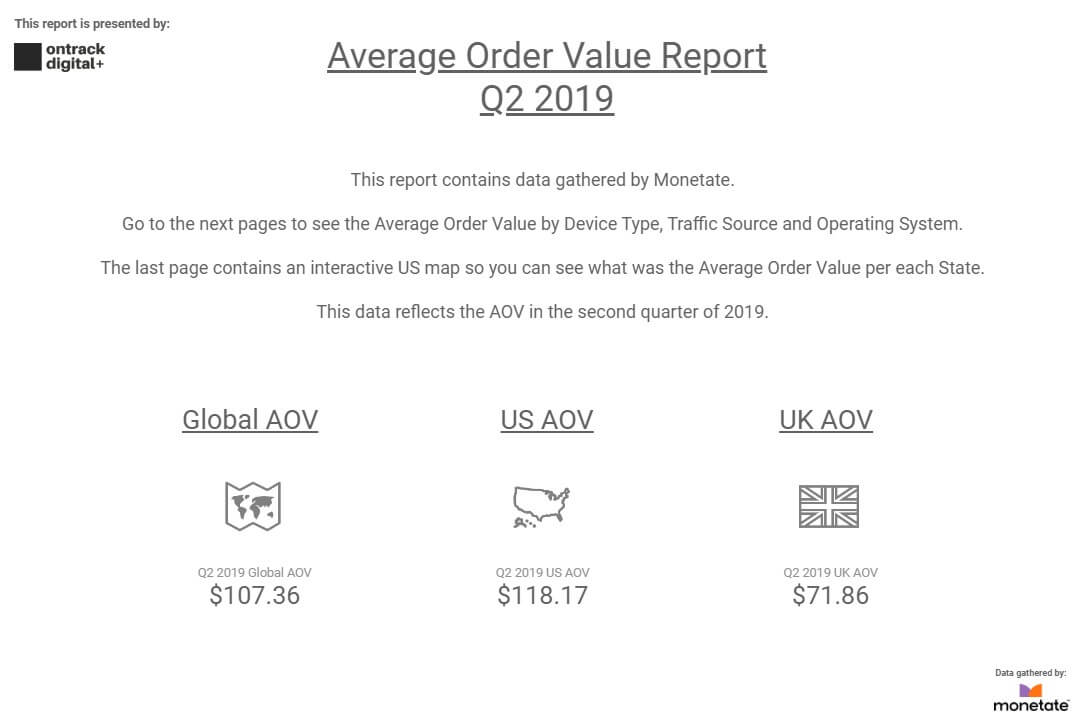
The Global Average Order Value in the ecommerce world is $107.36. It presents a slight increase of $1.69 compared to the prior 12 months, when the global AOV was around $105.67.
Americans tend to spend more money than the average global population, as the US AOV for the second quarter for 2019 reached $118.17.
UK’s AOV is way below the Global average: only $71.86 (around £57.68).
Average Order Value Report by Device – Q2 2019

Customers still choose desktops when they order something expensive. The data shows that the AOV of Desktop devices was $128.08 in the second quarter of 2019.
Tablets got on the second place, with an AOV of $96.88 (32% smaller than on desktop). But don’t get super excited about this. Because of the rapid growth of 2 in 1 devices that work both as a tablet and as a laptop, tablets are going extinct. The good news is that mobile devices are taking the e-commerce market by storm.
Before that happens, the data tells us that mobile devices are on the 3rd place in the world in terms of AOV. People that use their phones to purchase online spend on average $86.47.
The last device category is represented by other devices, like smart TVs, PS4s, Samsung Smart Fridge and any other device that can connect to the internet.
In the full report I’ve broken down the data and you can see what are the average order values by device in the US and UK.
Average Order Value Report by Traffic Source – Q2 2019

It certainly seems like people absolutely hate UTM parameters. Or maybe they just don’t know what they are. I’ve talked about the importance of UTMs on How to Double your ROAS in 2 months by analyzing your Source/Medium report so take a look if you are still uncertain what they mean.
Whatever the reason might be, unknown traffic has registered the highest AOV in Q2 2019: $112.24.
Direct traffic comes in close with an AOV of $112.01. This traffic is mainly comprised of people who are already familiar with the website they visit as they know its URL or have bookmarked it. It’s a well known fact that returning users are way above new visitors in terms of AOV, conversion rate and average session duration.
Email marketing is still alive and doing pretty well. The AOV generated by email traffic is $105.59, bigger than both Search Traffic ($94.58) and Social Traffic ($79.01).
Average Order Value Report by Operating System – Q2 2019

The past few years have proven to all of us that Mac users have the highest purchase power. After all, just a monitor stand costs $1000! The data points this out yet again: Mac users have the highest AOV, $132.60.
Closely after comes Windows, with an AOV of $127.77. On the other side, the Windows Phone AOV is the smallest one (almost 2 times smaller than Mac): $66.06.
You can start running campaigns targeted at desktop users, be it Windows or Mac. Beware that people are using their phones to browse and their desktops to buy.
Average Order Value by US State – Q2 2019

The last part of the report is an interactive US map.
It was surprising to find that the highest AOV in the US is achieved by Alaska. These people are spending $146.65 on average on their orders. On the other end of the spectrum we found Pennsylvania and Rhode Island, with an average order value of just $98.58.
Take a look at the complete map and see how much money is your target audience spending on average per their order.
You will need to look at the report from your Desktop as DataStudio is not mobile friendly at all.
Here is the AVerage Order Value Report – Q2 2019: