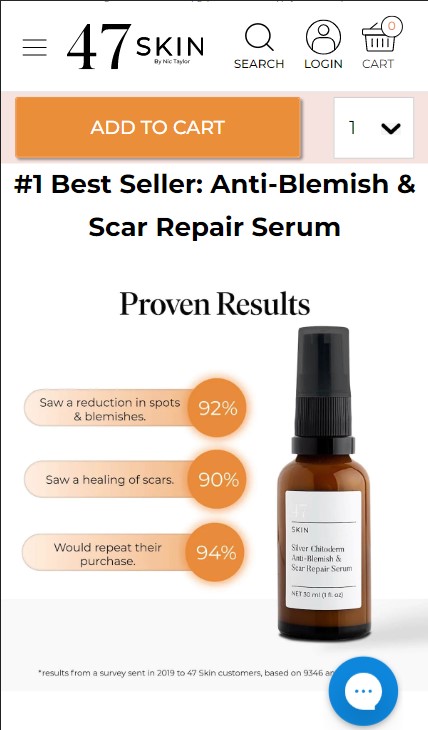
Gain 20% More Revenue with a Ratings Distribution Chart
Product Origin Transparency Leads to Increased Sales
By Irina Mihailescu Grigoras
/ September 30, 2022
See how we brought an uplift to our client's sales by being transparent about the origin of the products.
Read More
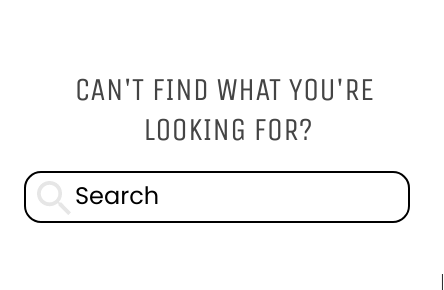
Increase the Conversion Rate by 14% with a Visible Search Bar
By Irina Mihailescu Grigoras
/ September 30, 2022
See how we brought an uplift to our client's conversion rate by being adding a visible search bar on collections...
Read More
Gain 20% More Revenue with a Ratings Distribution Chart
By Irina Mihailescu Grigoras
/ September 29, 2022
See how we brought an uplift to our client's sales by being adding a ratings distribution chart on product pages.
Read More
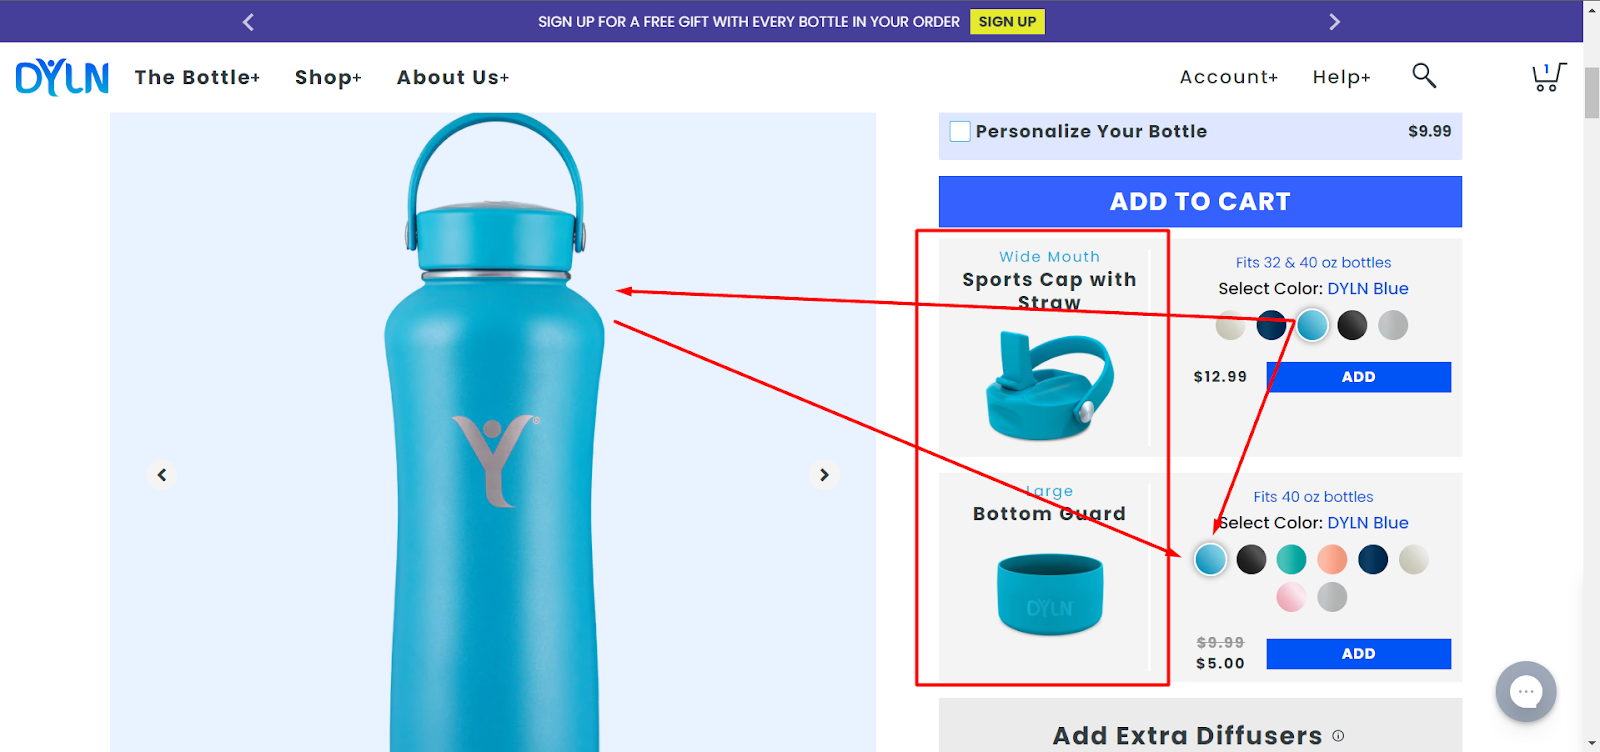
Bring +30% More Revenue by Matching Upsells to Products
By Irina Mihailescu Grigoras
/ July 18, 2022
See how we brought an uplift to our client's revenue by matching upsell colors to the products.
Read More
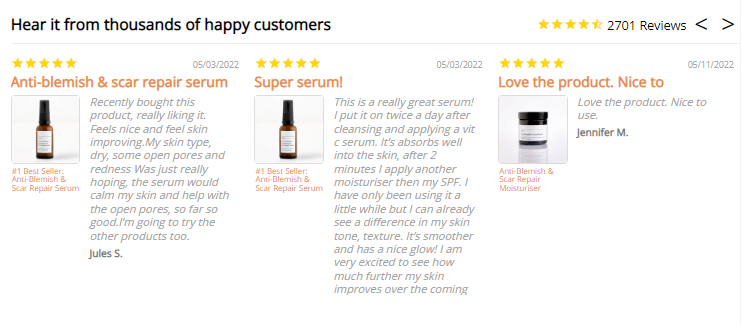
Increase Your Conversion Rate by 23% by Adding A Reviews Widget
By Irina Mihailescu Grigoras
/ July 13, 2022
See how we brought an uplift to our client's conversion rate by adding a trusty reviews widget on the homepage.
Read More
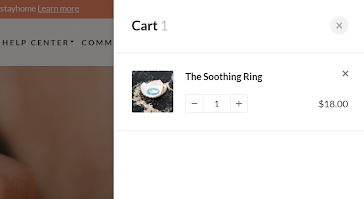
How Extra Steps Can Add Friction to the Sales Funnel
By Irina Mihailescu Grigoras
/ January 31, 2022
See how adding a drawer cart can improve the performance of the overall sales funnel.
Read More
A Good Hero Section Can Bring a 13% Uplift in Conversion Rate
By Irina Mihailescu Grigoras
/ January 31, 2022
See how we brought an uplift to our client's conversion rate by optimizing the hero section.
Read More
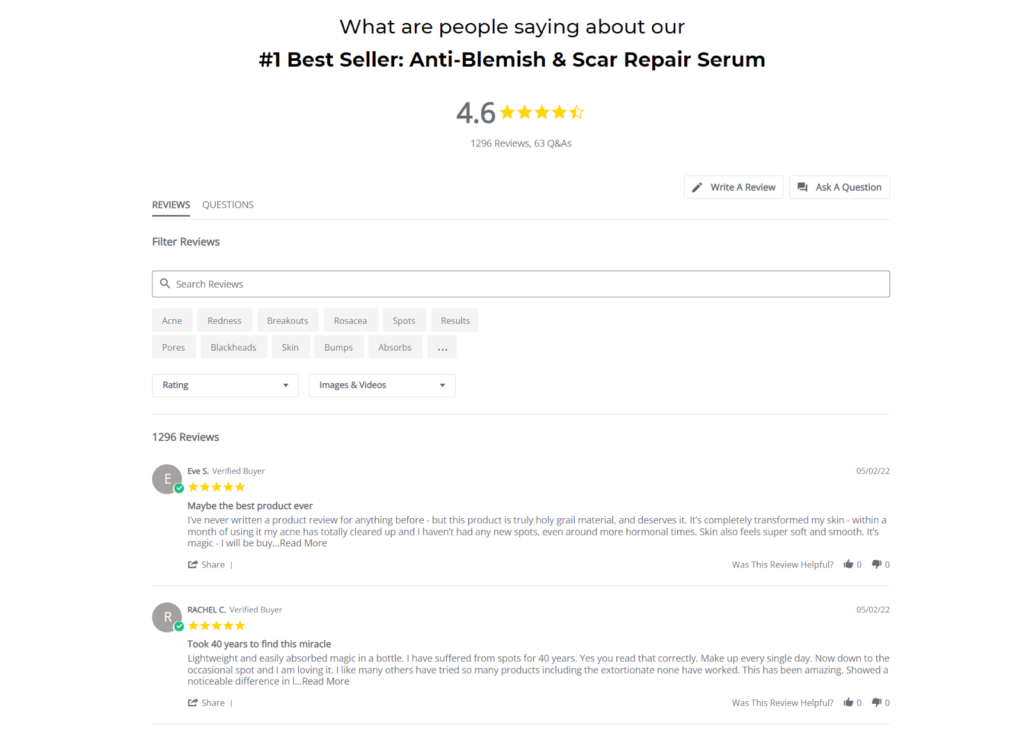
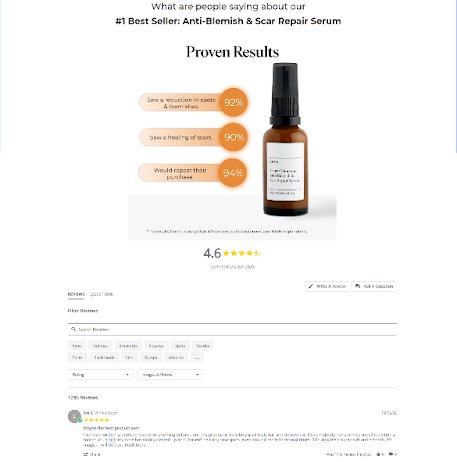
Highlighting Ratings and Reviews Brings a 7% Increase in Conversion Rate
By Irina Mihailescu Grigoras
/ January 31, 2022
Read how you can increase your ATC and conversion rates by highlighting ratings and reviews on the product pages.
Read More
Increased accessibility and contrast leads to increased conversion rates
By Irina Mihailescu Grigoras
/ January 31, 2022
Read how using a contrasting color scheme can potential customers further down the sales funnel.
Read More
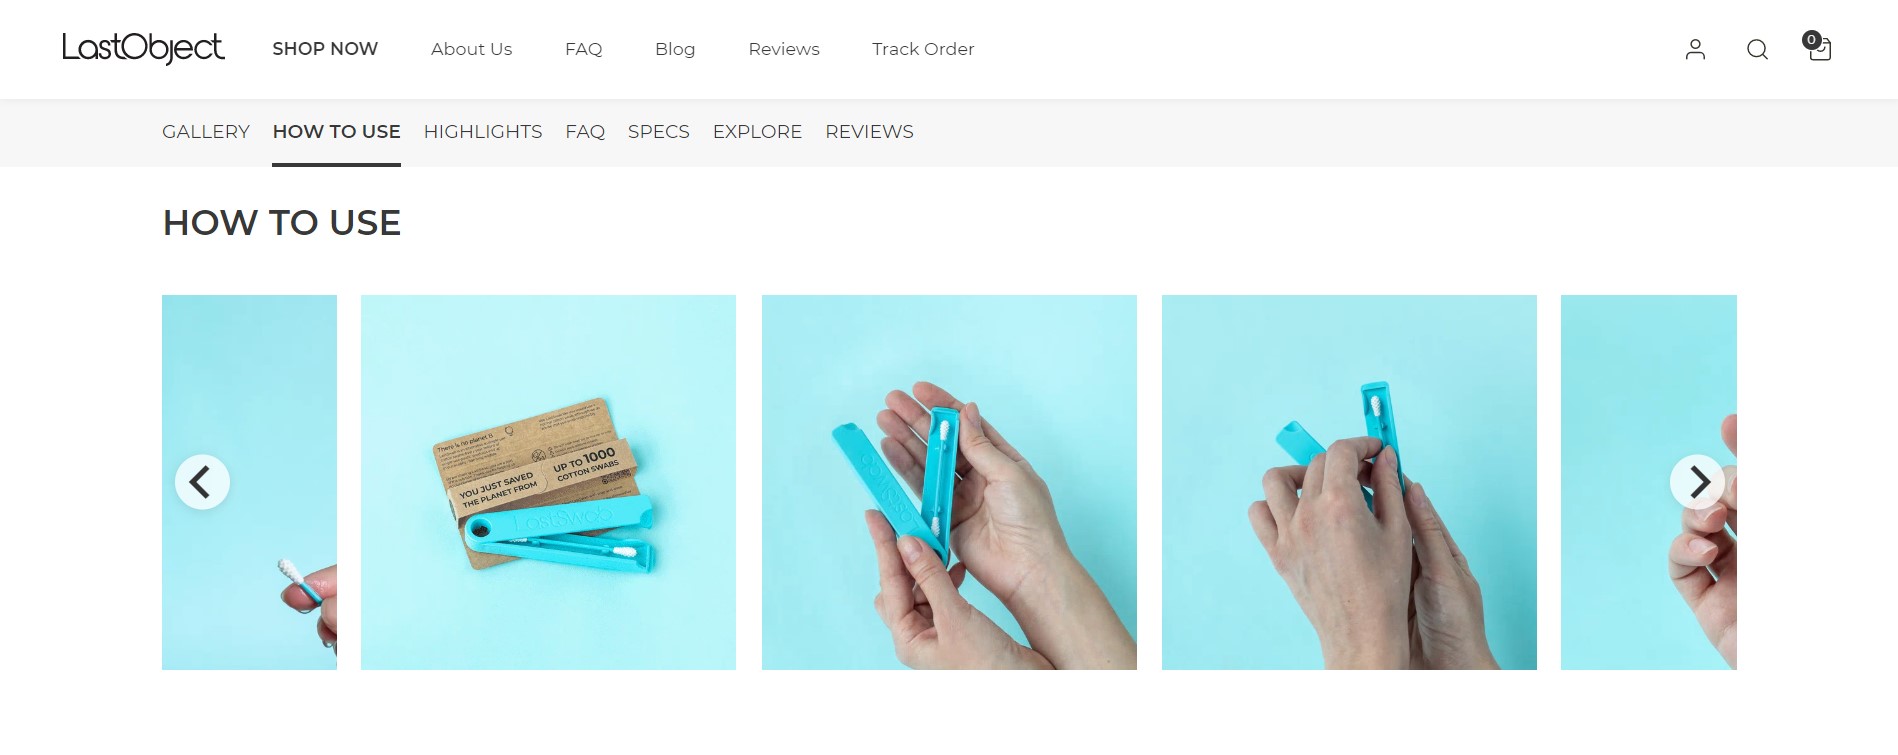
Boost Your Sales with an Explanatory GIF Set
By Irina Mihailescu Grigoras
/ December 6, 2021
See how we increased our client's ecommerce conversion rate by adding explanatory GIFs on product pages.
Read More